

In which I provide a template for generating fancy, production quality tables for theses...
LaTeX as I've mentioned previously, is a document preparation system well known for its brilliant equations and can also be utilised to make very nice looking diagrams. The tables it generates, however, while neat are a little lacklustre. This is aimed as a very simple guide to editing tables (regular LaTeX users may find this tutorial very basic).
Before starting you will need a LaTeX compiler and a text editor (SciTE is awesome). On Windows TeXnicCenter & MiKTeX provide good functionality. Under Linux you can use TeX Maker.
Setting Up the Document
First you need to have a document class set up and the beginning and end of your document:
\documentclass{article}
all your packages will be loaded here and other modifications to commands
\begin{document}
document code will go here
\end{document}
Then you need to make sure you are calling all the relevant packages to make our fancy tables work:*
\usepackage[landscape,a4paper]{geometry}
\usepackage{booktabs}
\usepackage{colortbl}
\usepackage{xcolor}
\usepackage{xfrac}
The geometry package will simply rotate your outputted pages to landscape. As tables may often be fairly wide this allows the whole table to fit on the page without giving a bad box warning or cutting off part of the table.†
The booktabs package provides extra tables commands and in general makes tables look a little nicer than without.
The colortbl & xcolor packages are required to allow the colour of table and text elements to be altered.
The xfrac package is required to make nicer fractions that look good in tables.
A new command is required:
\newcommand{ra}[1]{renewcommand{arraystretch}{#1}}This will allow you to change the row spacing to your liking by invoking the ra{} command. I found that 1.3 was sufficient.
*Further package documentation covering the use of these packages is available at the CTAN repository.
†Though you can have LaTeX just output the images to an image format too.
The Core of the Table
The Booktabs package guide defines the following rules for publication quality tables and you should bear them in mind while designing your table:
Never, ever use vertical rules.
Never use double rules.
Put the units in the column heading (not in the body of the table).
Always precede a decimal point by a digit; thus $latex 0.1$ not just $latex .1$.
Do not use ‘ditto’ signs or any other such convention to repeat a previous value. In many circumstances a blank will serve just as well. If it won’t, then repeat the value.
With these guidelines in mind you need to layout your table:
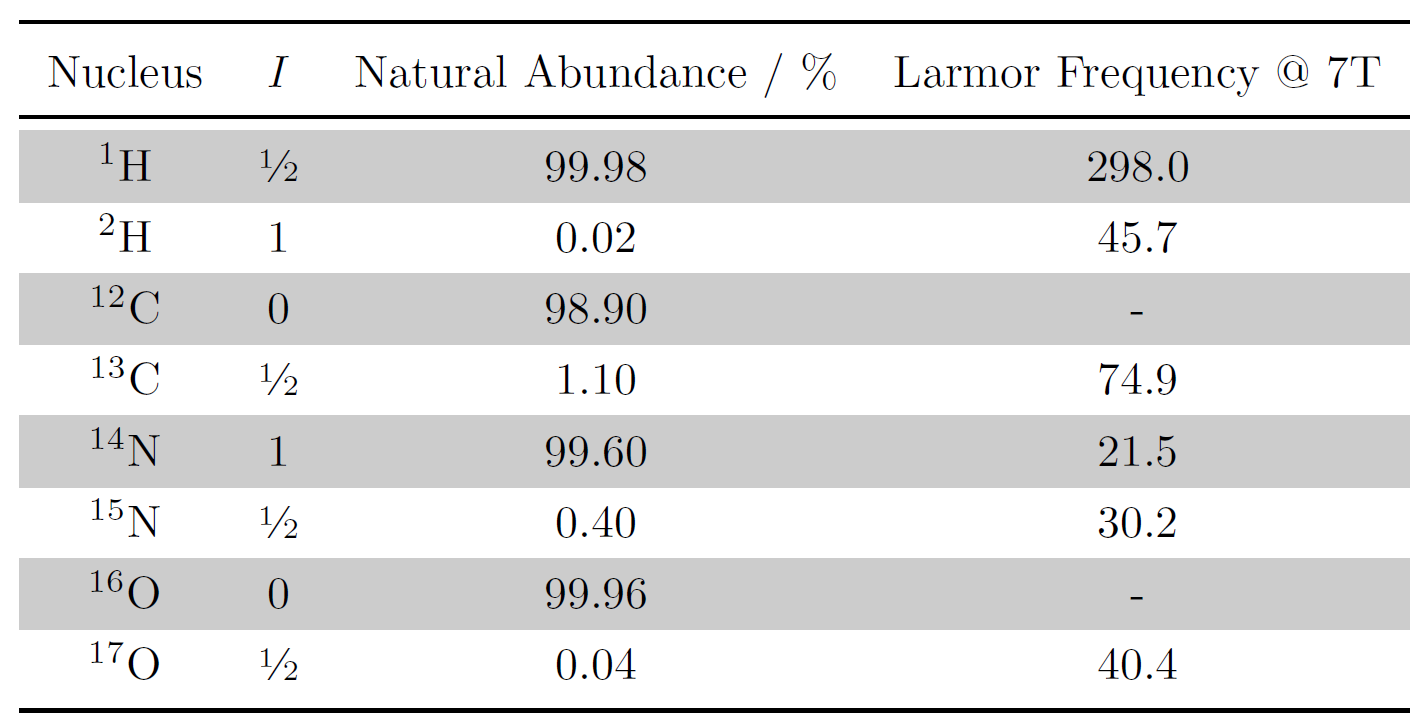
\begin{tabular}{cccc}
\toprule
Nucleus & textit{I} & Natural Abundance / \% & Larmor Frequency @ 7T \\
\midrule
\rowcolor{black!20} \textsuperscript{1}H & \sfrac{1}{2} & 99.98 & 298.0 \\
\textsuperscript{2}H & 1 & 0.02 & 45.7 \\
\rowcolor{black!20} \textsuperscript{12}C & 0 & 98.90 & - \\
\textsuperscript{13}C & \sfrac{1}{2} & 1.10 & 74.9 \\
\rowcolor{black!20} textsuperscript{14}N & 1 & 99.60 & 21.5 \\
\textsuperscript{15}N & \sfrac{1}{2} & 0.40 & 30.2 \\
\rowcolor{black!20} \textsuperscript{16}O & 0 & 99.96 & - \\
\textsuperscript{17}O & \sfrac{1}{2} & 0.04 & 40.4 \\
\bottomrule
\end{tabular}
The first thing to do is invoke the tabular environment and tell it how many columns you want to have: begin{tabular}{cccc}. The number of letters in the second set of brackets is the number of columns you wish to have. The letter used controls the alignment of the text. Personally I prefer centred text (c) but you can align left (l) or right (r) too if you like.
Before you start with the body of your table you will want a toprule which provides a thicker horizontal line than the standard LaTeX hline.
Each row of the table consists of your text aligned using ampersands and ending with a double backslash. You don't require an ampersand at the start or end of the row - only between columns. For example:
First column & Second column & Third column \\Once you have defined your top row you should follow it with a midrule before starting the table body. This will provide a nice horizontal line signifying the start of the table.
One the first row of the table body change the row colour to light grey using the rowcolor command: rowcolor{black!20}.§ Then fill out your row as normal. Alternate between grey and white rows to distinguish between rows without the need for unnecessary horizontal lines.
Once you have finished your table end with a bottomline before closing the table (end{tabular}). If you are including your table in a LaTeX document you can place your caption and label after the tabular environment.
A major benefit of designing your table in this manner with alternating colours is that you can easily have double thickness rows when text overflows in a box. For example:
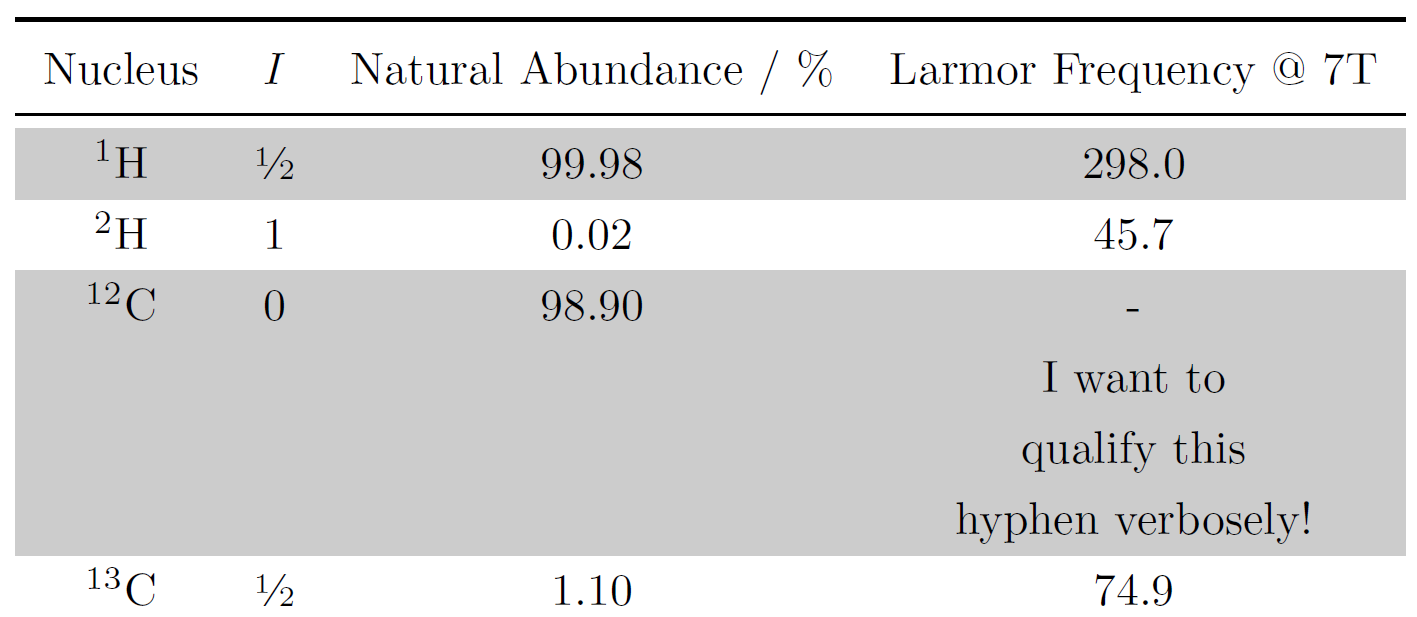
§The number after the exclamation mark is the transparency of the colour; 20 means the colour is 80% transparent. For the full colour you can just put rowcolor{red}.
Common Errors
If you get an error saying "Extra alignment tab has been changed to cr" you have likely missed putting \\ at the end of one of your table rows.
If you get an error saying "misplaced noalign" you have probably put one of your ruled lines in a weird place.
Final Result
You can also download the file to try here.
Tom Out!
Acknowledgements
This reply to this post by Harish Kumar and the reply to this post by dcmst proved very useful in designing by thesis tables.


